Python pandasのメモ
Python pandasが難しいので、メモ。
データ構造
Series : 1次元のデータ
DataFrame : 2次元のデータ
時間系
Time Series / Date functionality — pandas 0.20.3 documentation
TimestampとPeriodの2種類がある。 Timestampは、ある時点を表す。 Periodは、ある期間を表す。
TimestampをDataFrameのIndexとして取ると、DateTimeIndexとなる。 時系列データはこれで表すと良い。 DateTimeIndexで表現されるデータを処理するための関数群が用意されている。
リサンプリング
pandas.DataFrame.resample()を使う。
アップサンプリング・ダウンサンプリングともに可能。
リサンプリング時のデータの補完/集計方法はpandas.Resamplerのメソッドとして定義されている。
アップサンプリングの例(線形補間)
import pandas as pd

time_index = pd.date_range("2017-10-01 10:00:00", periods=3, freq="S")
print(time_index)

df = pd.DataFrame([0, 100, 300], index=time_index)

print("-----------------------")
print("Before resampling")
print(df)

df_resampled = df.resample("500ms").interpolate("linear")

print("-----------------------")
print("After resampling")
print(df_resampled)
DatetimeIndex(['2017-10-01 10:00:00', '2017-10-01 10:00:01',
               '2017-10-01 10:00:02'],
              dtype='datetime64[ns]', freq='S')
-----------------------
Before resampling
                       0
2017-10-01 10:00:00    0
2017-10-01 10:00:01  100
2017-10-01 10:00:02  300
-----------------------
After resampling
                             0
2017-10-01 10:00:00.000    0.0
2017-10-01 10:00:00.500   50.0
2017-10-01 10:00:01.000  100.0
2017-10-01 10:00:01.500  200.0
2017-10-01 10:00:02.000  300.0
リサンプリングの注意点
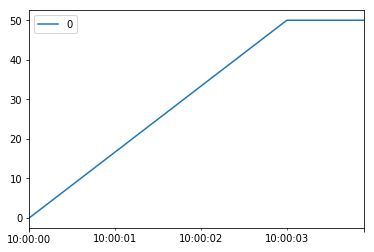
サンプリング周期によっては、元データと同じ時間がリサンプリング後に現れない場合がある。(1秒間隔のデータを300ms周期でリサンプリングした場合など )
その場合、リサンプリング後に現れなかった時間のデータは補完されない。
import pandas as pd
import matplotlib.pyplot as plt

time_index = pd.date_range("2017-10-01 10:00:00", periods=5, freq="S")
print(time_index)

df = pd.DataFrame([0, 100, 300, 50, 0 ], index=time_index)

df_500ms_resample = df.resample("500ms").interpolate("time")
print("-----------------------")
print("500ms resampling")
print(df_500ms_resample)


df_300ms_resample = df.resample("300ms").interpolate("time")
print("-----------------------")
print("300ms resampling")
print(df_300ms_resample)

plt.clf()
df_500ms_resample.plot()
df_300ms_resample.plot()
plt.show()
DatetimeIndex(['2017-10-01 10:00:00', '2017-10-01 10:00:01',
               '2017-10-01 10:00:02', '2017-10-01 10:00:03',
               '2017-10-01 10:00:04'],
              dtype='datetime64[ns]', freq='S')
-----------------------
500ms resampling
                             0
2017-10-01 10:00:00.000    0.0
2017-10-01 10:00:00.500   50.0
2017-10-01 10:00:01.000  100.0
2017-10-01 10:00:01.500  200.0
2017-10-01 10:00:02.000  300.0
2017-10-01 10:00:02.500  175.0
2017-10-01 10:00:03.000   50.0
2017-10-01 10:00:03.500   25.0
2017-10-01 10:00:04.000    0.0
-----------------------
300ms resampling
                            0
2017-10-01 10:00:00.000   0.0
2017-10-01 10:00:00.300   5.0
2017-10-01 10:00:00.600  10.0
2017-10-01 10:00:00.900  15.0
2017-10-01 10:00:01.200  20.0
2017-10-01 10:00:01.500  25.0
2017-10-01 10:00:01.800  30.0
2017-10-01 10:00:02.100  35.0
2017-10-01 10:00:02.400  40.0
2017-10-01 10:00:02.700  45.0
2017-10-01 10:00:03.000  50.0
2017-10-01 10:00:03.300  50.0
2017-10-01 10:00:03.600  50.0
2017-10-01 10:00:03.900  50.0


<matplotlib.figure.Figure at 0x11268e7f0>
500msサンプリング時

300msサンプリング時

これに対する今のところの対策は、一回十分に短いサンプリング周期でアップサンプリングして、その後所望のサンプリング周期にダウンサンプリングするという手法でなんとかなる。